Project Prophesy - OSINT on stock market
How to do market intelligence like the CIA: A practical guide

In this article, we will look at the CIA project dubbed Prophesy. Its main task was to predict specific events, especially terrorist attacks, by monitoring the stock market and other open-source feeds.
This research was inspired by Project Prophesy from the book "The death of money - The coming collapse of the international monetary system" by James Rickards.
Introduction
The first time I heard about non-conventional attacks on US monetary system was in James Rickards' book. He described potential warfare and different types of offensives on financial infrastructure and monetary systems. Such attacks might involve sleeping Chinese cells or inside terrorist trading, and we'll take a deeper look at the second.
One purpose of war is to degrade the enemy’s will and economic capacity. Surprising as it may sound, wealth destruction through a market attack can be more effective than sinking enemy ships, when it comes to disabling an opponent. Financial war is the future of warfare.
Chapter 1 of the book describes the CIA project, launched in 2002, which gathered two hundred finance professionals - hedge fund managers, Nobel Prize winners, and wall street traders. All of them participated in the project to predict the future based on the stock market exchange.
CIA was aware of unusual trading activity for the airline and other stocks before the 9/11 terrorist attacks, but they had no expertise in this field. Therefore, these leads were not investigated in any great depth. The agency were sure that terrorists would strike again and abuse stock trading, so that's how Project Prophesy has been born.
Concept
Currently, everyone can track the prices, volume, or momentum of any stock thanks to a variety of free and commercial sources. Also, you can have access to details and analysis of the market through specialized software, artificial intelligence, and the opinion of other experts. At that time, CIA had only gathered a group of experts to help them write sophisticated software and analyze results.
According James, there are three steps to detect trading anomalies, mostly related to insider or terrorist trading.
- Establish a baseline for normal trading via metrics like volatility, average daily volume, put-call ratios, short interest, and momentum.
- Monitor trading and spot anomalies relative to the baseline.
- Check open source information to see if there is any public information to explain the move.
For example, stock will spike if acquisition of some company will be announced, but it's expected. Journey starts when there are spikes without any public information about the company.
CIA even prepared a red teaming scenario. Imagine this - the biggest minds from corporate finance world had to think like a terrorist and devise a way to trade on the inside information. One way was completely out-of-the-box, but I don't want to spoil it, you can read it in the book.
Our job wasn’t quite finished, as by early 2004, Project Prophesy was ready to build a prototype watch center. When integrated with other classified sources, the system, ideally, would have the capability of interpreting, say, a scrap of pocket litter picked up from a suspected terrorist in Pakistan. The words cruise ship scrawled on it would be integrated with a red signal from the watch center on a public company such as Carnival Cruise Lines to bolster the case for a planned attack on a Carnival vessel. Either clue is revealing, but the combination is exponentially more telling.
MARKINT
With funding from CIA-backed Venture Capital - INQTEL, Project Prophesy came to the next phase, and by early 2006, the system was running. Funnily enough, they detected many cases of insider trading mostly based on open source information and had to redirect them to SEC - "We called this our catch-and-release policy. We were hunting terrorists and would leave ordinary Wall Street crooks to others."
On the 7th of August, 2006 system started blinking red, which indicates a possible terrorist attack on American Airlines.
Three days after the alarm rang, Scotland Yard uncovered the failed terrorist plot in London that targeted American Airlines, amongst others. The system was fully working and able to predict terrorist attacks. It was a big success for the whole team, and even more than that, their model predicted the exact time when an attack would occur. Of course, Project Prophesy had nothing to do with uncovering the attack; British and Pakistani Intelligence Services were surveilling responsible individuals for months before it happened.
One of the terrorist associates in the London social network woke up on Monday, August 7, and started the trading in American Airlines that snowballed into the highly unusual pattern that had triggered the red light on our threat board. Someone had been betting on a sure thing, exactly as our behavioral modeling had predicted.
The whole operation was completely legal and ethical, there is no mention of confidential sources though, but we can assume it was related to money-transfer US companies obligated to the Patriot Act.
Central Intelligence Agency was involved in many scandals at that time, and public opinion would not be satisfied with another one related to the privacy of US citizens. This reason and other political/jurisdictional concerns put an end to Project Prophesy and cooperation with the CIA.
I countered that we did not use individual trading records but relied entirely on open-source market price feeds available to everyone; I told them it was not much different than watching TV.
It has extended it's capabilities and become a system to not only detect terrorist attacks but to monitor marketplace actions of dictators, strategic rivals, and other state actors. The system had to be calibrated for specific events or sources, and based on that make decisions and trigger alerts.
This project shows another enormous usage of OSINT and the future of monetary warfare. Currently the tool is used as a kind of radar to detect potential financial threat to the US monetary system.
Insider trading
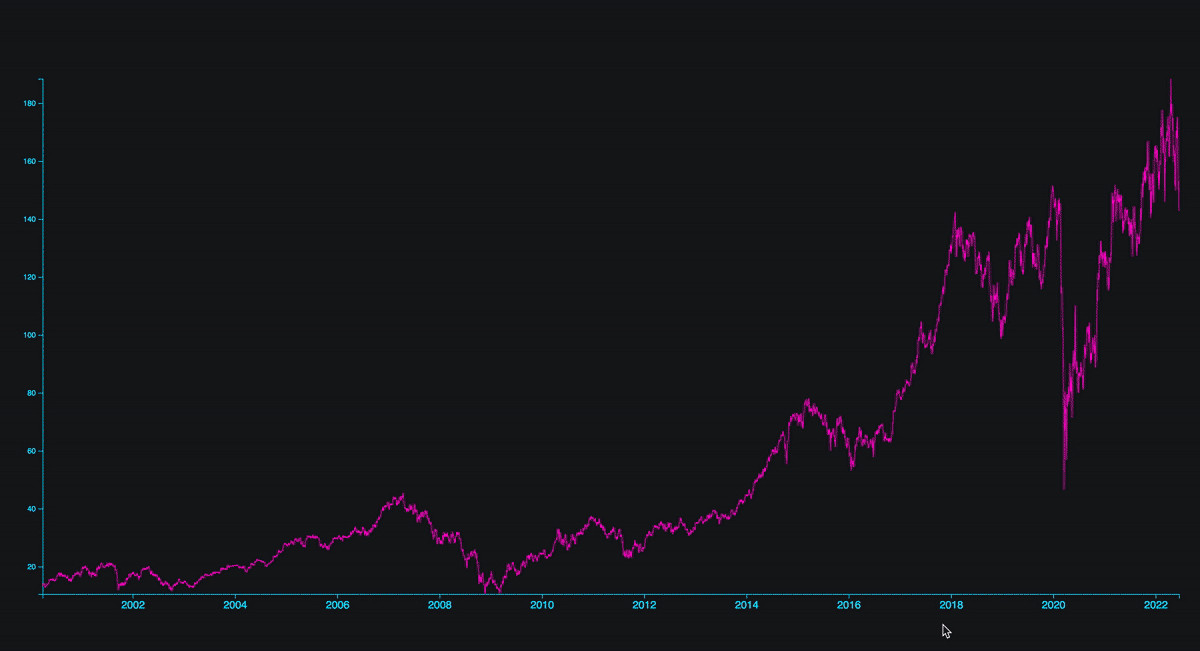
Insider trading often happens during an acquisition or big announcement from a company, such as discovering a new drug or technology. Let's take a look at a very simple case released on March 23, 2022.
The graph below presents the volume of microchip producer Liner Technology Corporation, and you don't have to be a trading expert to deduce that something happened between the 25th and 26th of July 2016. The spike is clearly visible and volume grew from 48,38 to 62,40 on the 26th.
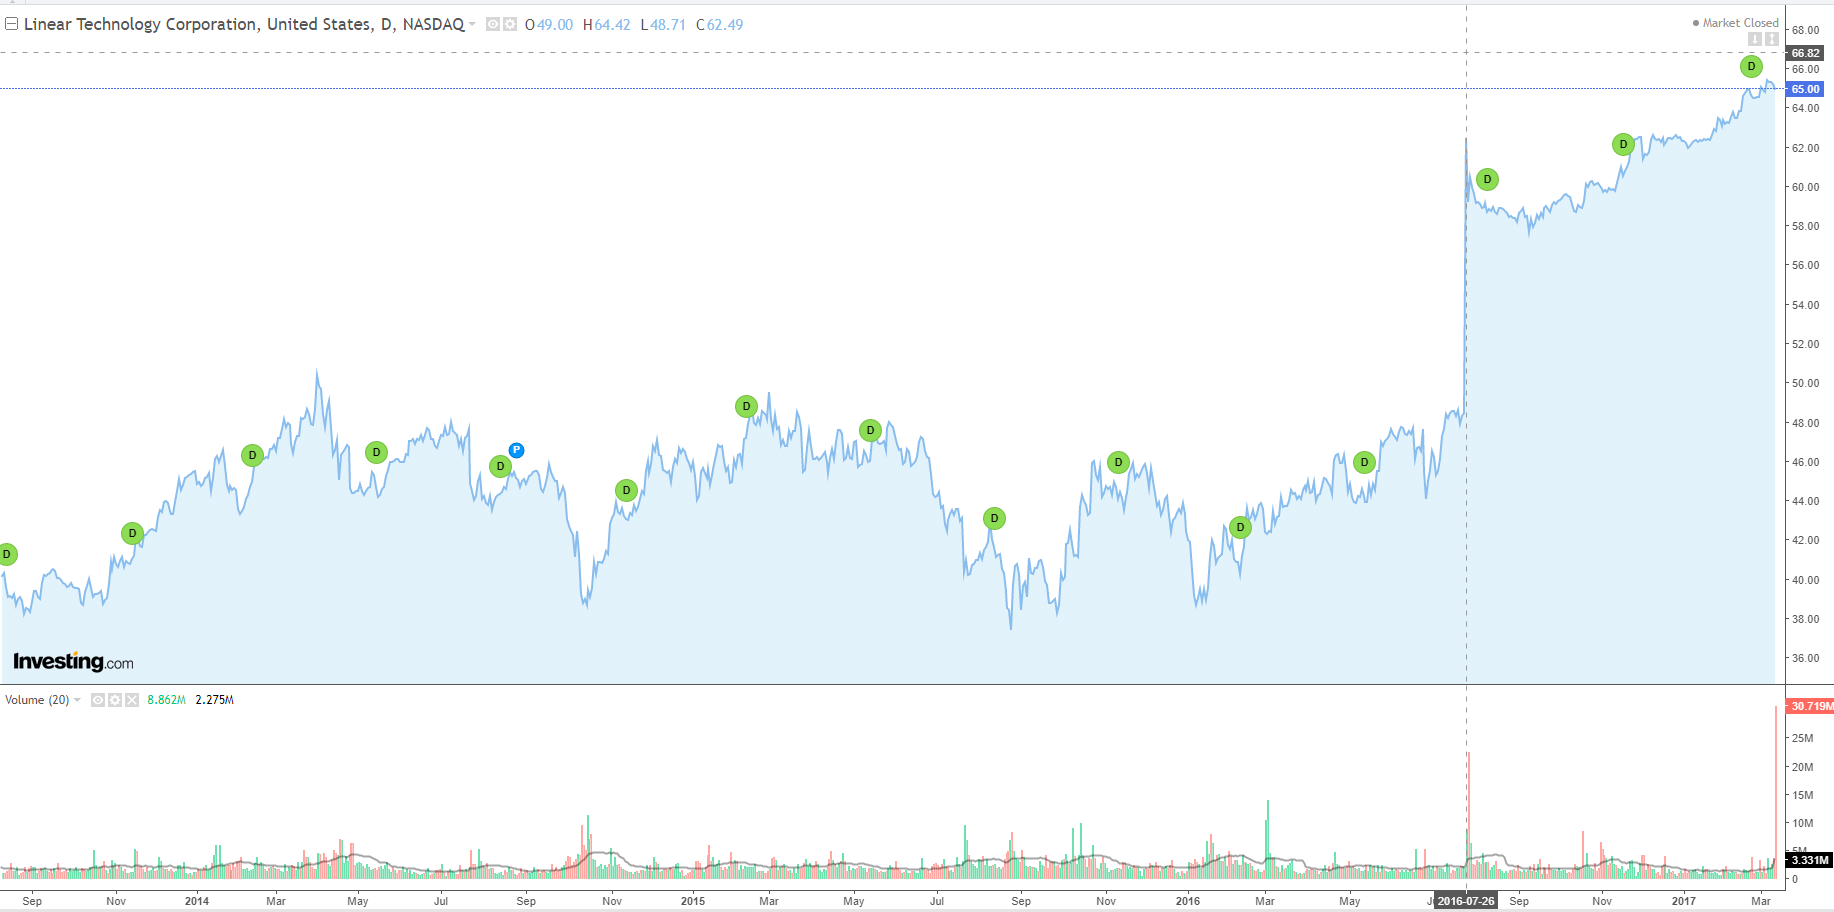
That day Analog Devices, Inc. (NASDAQ: ADI) publicly announced acquisition of Linear Technology Corporation (NASDAQ: LLTC).
David Forte, gained knowledge about the acquisition from his brother, senior executive at Analog Devices, and he passed information about the deal to two of his close friends, Younis and Manning.
Younis purchased shares of Linear stock and call options (bets that the price of a stock will increase prior to the expiration of the option) in the week leading up to the public announcement of the acquisition on July 26, 2016.
Manning and Younis made $7,979 and nearly $52,000 in profits, respectively. A third person made $11,017 based on a trading tip by Younis.
It was as easy as that. If an individual owns confidential information they can abuse it and buy shares, which is, of course, illegal and the charge of conspiracy to commit securities fraud provides for a sentence of up to 25 years in prison, five years of supervised release, and a fine of $250,000 or twice the gross gain or loss, whichever is greater.
Terrorist trading
It's not very different from insider trading. In both cases an individual gains personal benefits from trading, having knowledge about potential future events. Except for the mentioned discovery of new technology or cancer drugs, terrorist attacks are not different - these events can influence the stock prices of affected organizations.
Notably, the Global Terrorism Database (GTD) offers a comprehensive resource for researching such incidents, including attack types, geographic regions, casualty numbers, and the perpetrator groups involved. While some terrorist plots have been thwarted, regrettably, thousands of others have been executed globally. The consequences of such actions can have far-reaching impacts on financial markets and must be taken into account in risk management and mitigation strategies.
Not every attack has some implications in stock prices, some of them are just typical terror attacks not intended to make money but rather to make people feel unsafe. You can extract important events from GTD and corelate it with price/volume of affected organizations.
Using ChatGPT, we can quickly get exact names of companies whose stocks were affected by terrorist attacks.
~~ Give exact companies that were affected by terrorist attacks and how it impacted stock price, other than 9/11
Another example of a company that was affected by a terrorist attack is the Marriott International hotel chain, following the 2008 Mumbai terrorist attacks. On November 26, 2008, a group of militants carried out a series of coordinated attacks across Mumbai, India, including an assault on the luxury Taj Mahal Palace Hotel and the nearby Trident-Oberoi Hotel, both of which are managed by Marriott International.
The attack had a significant impact on Marriott's stock price, which fell by over 6% in the days following the attack. The decline was attributed to concerns about the company's exposure to security risks in emerging markets, as well as the potential impact on its revenue and reputation in the wake of the attack.
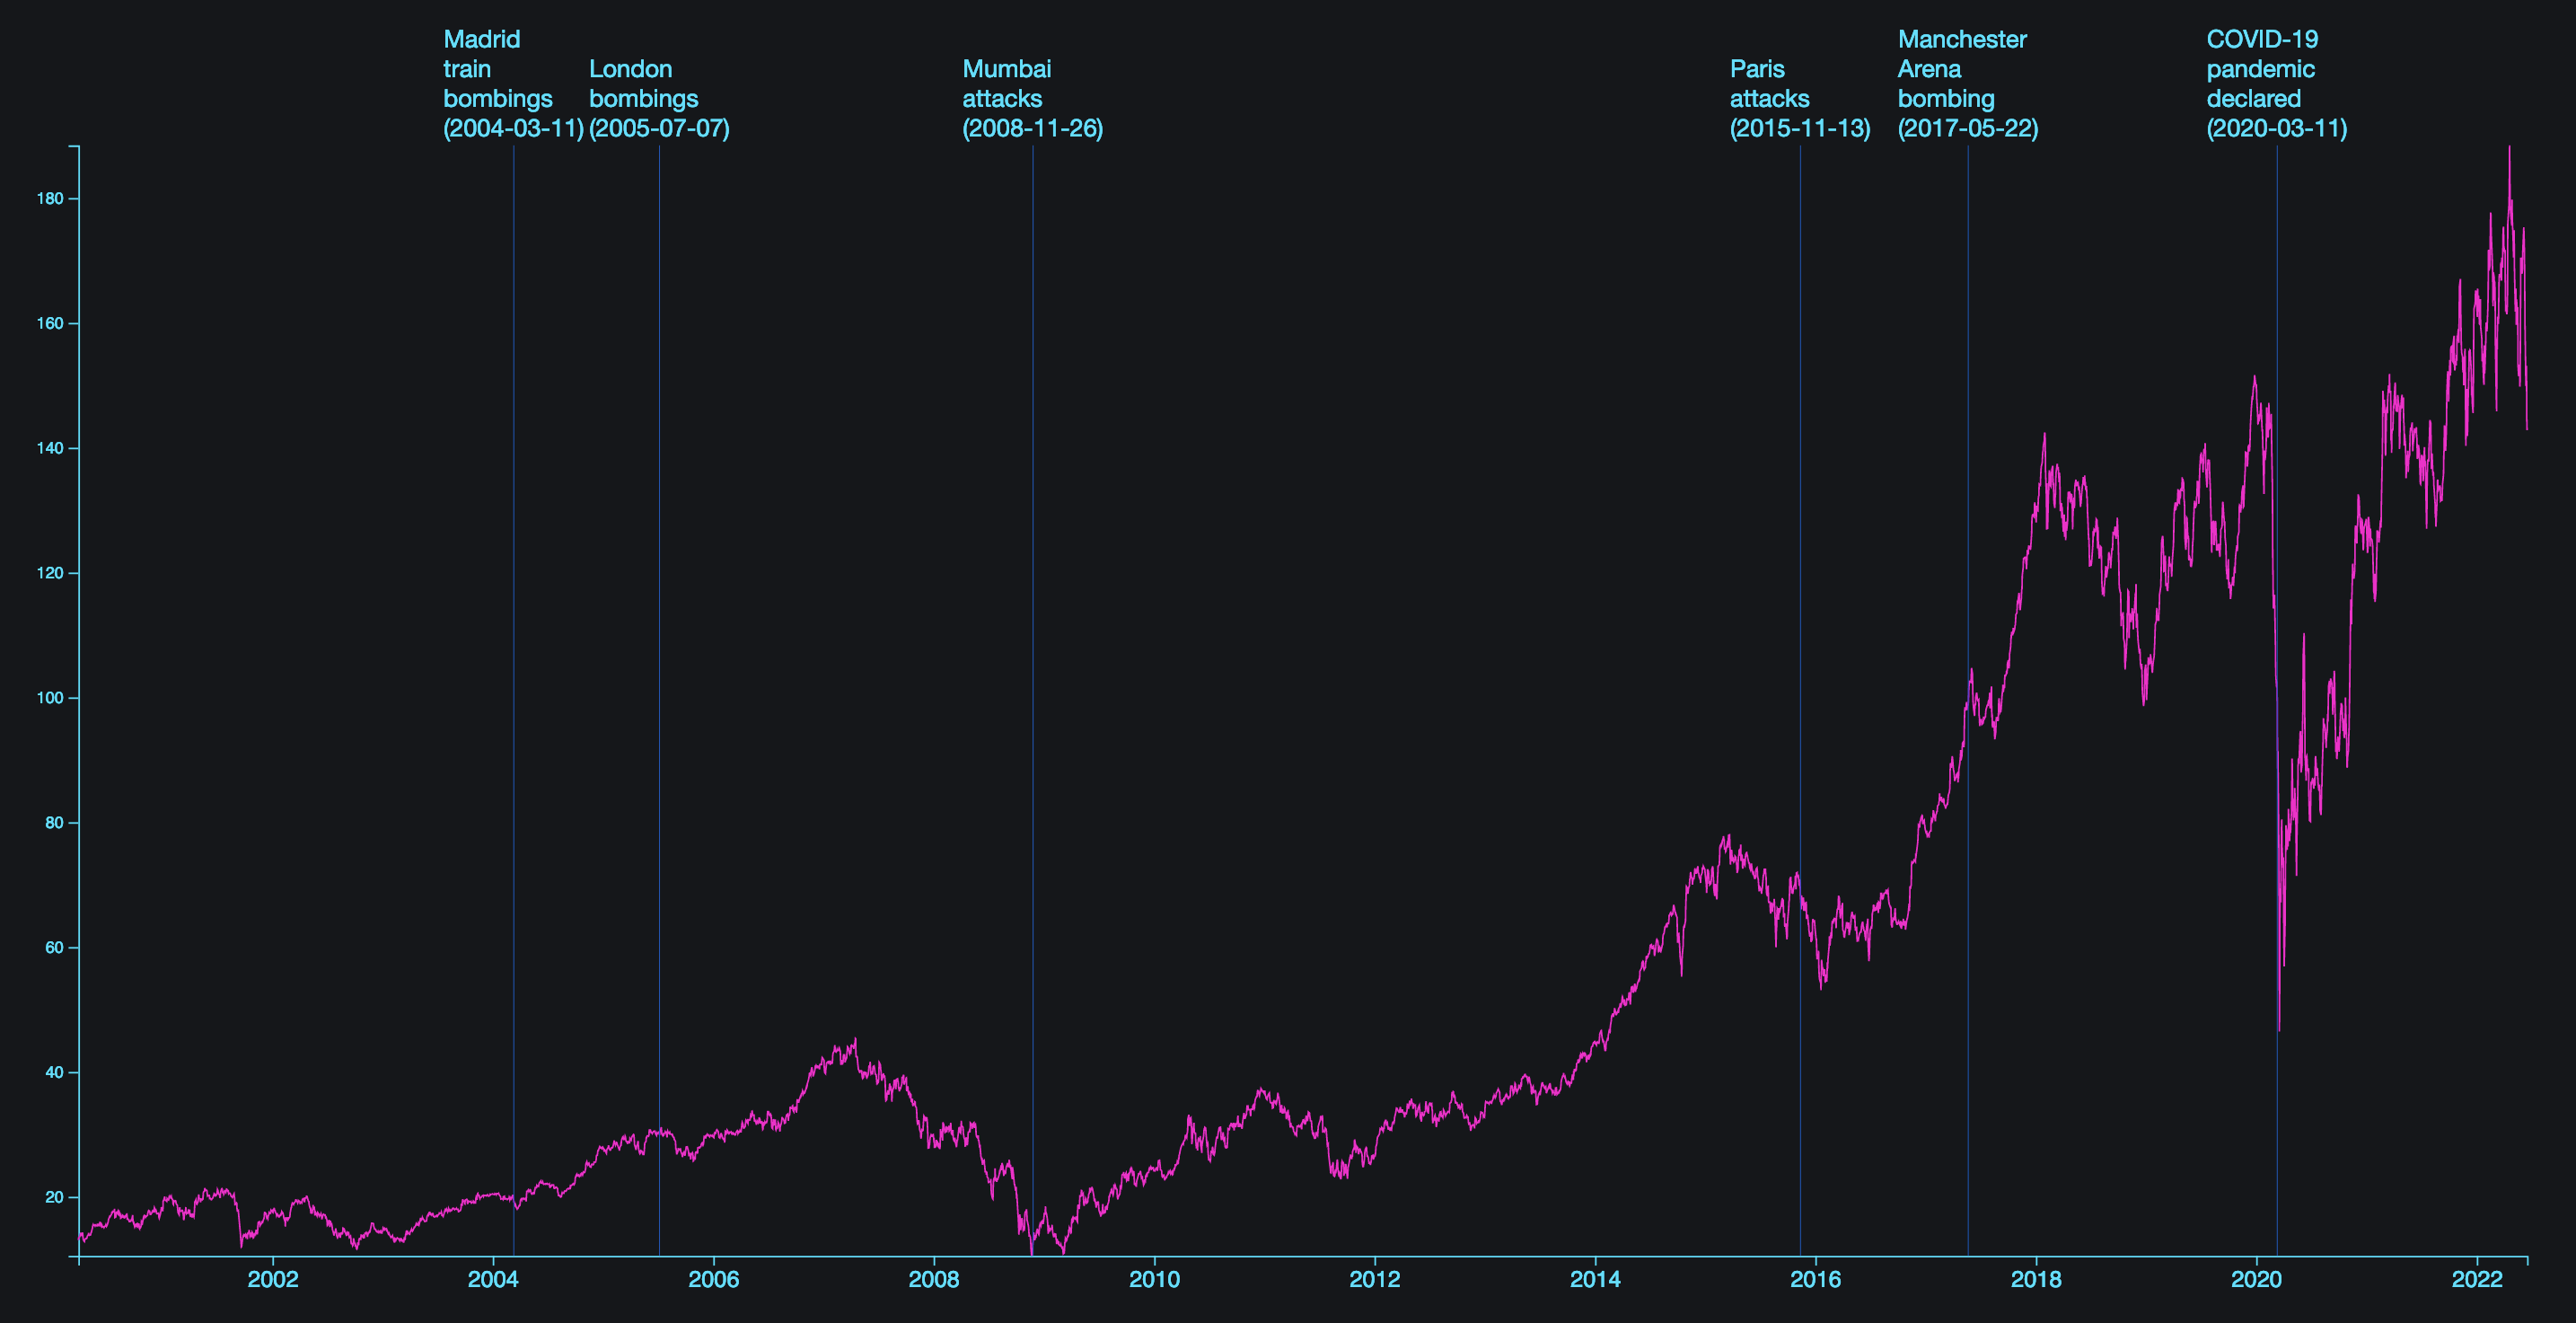
After this quite extensive introduction, we can move to the point of the whole article, which is to learn how to present specific events and correlate them with stock prices. Below is the representation graph in D3.js for Marriot stock prices and particular events around the world. We can clearly see the drop on 26.11.2008.
Stock prices & D3js & Annotations
Our main assumption and the goal of the graph is to capture the relationship between stock prices and share volume in reference to significant global events. This enables swift analysis of stock behavior in relation to the occurrences, facilitating insights into the extent of their influence on the market.
It's important to be careful when interpreting sudden changes in volume or price that occur around an event. Such changes may not necessarily be linked to the event, and it's necessary to investigate other possible factors that could contribute to the fluctuations. Many things can impact stock prices, both inside and outside of the company, so it's essential to conduct a thorough analysis and research to determine the cause of the changes.
Now we will go through the most important steps to create a chart graph. This visualization is open source on GitHub.
// set the dimensions and margins of the graph
var margin = {top: 100, right: 30, bottom: 20, left: 30},
  width = 1600,
  height = 800;

// append the svg object to the body of the page
var svg = d3.select("#my_dataviz")
  .append("svg")
  .attr("width", width)
  .attr("height", height + margin.top + margin.bottom)
  .append("g")

//Read the data
d3.csv("HTM.csv",

  // When reading the csv, I must format variables:
  function(d){
    return { Date : d3.timeParse("%Y-%m-%d")(d.Date), Volume : d.Volume, Low : d.Low}
  },

  // Now I can use this dataset:
  function(data) {

    var x = d3.scaleTime()
      .domain(d3.extent(data, function(d) { return d.Date; }))
        .range([ margin.left, width - margin.right]);

    var xAxis = d3.axisBottom().scale(x);

    svg.append("g")
    .attr("transform", "translate(0,"+ (height - margin.bottom) +")")
      .attr("class","myXaxis");

    // Add Y axis
    var y = d3.scaleLinear()
      .domain([0, d3.max(data, function(d) { return +d.Volume; })])
      .range([ height - margin.bottom, margin.top ]);
    var yAxis = d3.axisLeft().scale(y);

    svg.append("g")
    .attr("class","myYaxis")
      .attr("transform", "translate(" + margin.left + ", 0)");
After basic things like specifying dimensions and margins, we can read the data, which was gathered from finance.yahoo.com in the following format:
Date,Open,High,Low,Close,Volume
2016-01-05,0.62,0.62,0.61,0.62,134470
2016-01-06,0.62,0.62,0.60,0.61,145778
2016-01-07,0.60,0.62,0.59,0.60,263579
2016-01-08,0.60,0.62,0.59,0.60,164689
2016-01-11,0.60,0.62,0.59,0.62,174039
2016-01-12,0.62,0.62,0.59,0.60,174489
2016-01-13,0.60,0.62,0.59,0.61,331114
When you call "d3.scaleTime" make sure that range starts from the left margin, then annotations will fit X axis. Creating annotations in D3.js is very straightforward.
// Function to display event line
function event(date, desc){

/* Code below relevant for annotations */
  const annotations = [{
      note: { label: desc },
      subject: {
        y1: margin.top,
        y2: height - margin.bottom,
      },
      y: margin.top,
      data: { x: d3.timeParse("%Y-%m-%d")(date)}
    }

  ]

    const makeAnnotations = d3.annotation()
      .type(type)
      //Gives you access to any data objects in the annotations array
      .accessors({
        x: function(d){ return x(d3.timeParse("%Y-%m-%d")(date))},
        y: function(d){ return y(d.y) }
      })
      .annotations(annotations)
      .textWrap(80)
Then we initialize the graph and render data based on the type - price or volume.
x.domain([d3.min(source, function(d) { return d.Date }), d3.max(source, function(d) { return d.Date }) ]);

    svg.selectAll(".myXaxis")
      .transition()
      .duration(1000)
      .call(xAxis);

    // create y axis depends of the displayed type (volume, price)
    if (vtype=="volume"){
    y.domain([d3.min(source, function(d) { return +d.Volume  }), d3.max(source, function(d) { return +d.Volume  }) ]);
    }
    else
    {
      y.domain([d3.min(source, function(d) { return +d.Low  }), d3.max(source, function(d) { return +d.Low  }) ]);
    }

    svg.selectAll(".myYaxis")
      .transition()
      .duration(1000)
      .call(yAxis);
And the last part is to add the rest of the elements like the tooltip, circle, and movement of the cursor; it must follow the graph and always display a tooltip.
var focus = svg.append("g")
      .attr("class", "focus")
      .style("display", "none")


    focus.append("circle")
      .attr("r", 5)

    focus.append("rect")
      .attr("class", "tooltip")
      .attr("width", 150)
      .attr("height", 80)
      .attr("x", 10)
      .attr("y", -22)
      .attr("rx", 4)
      .attr("ry", 4);

    svg.append("rect")
      .attr("class", "overlay")
      .attr("width", width)
      .attr("height", height)
      .on("mouseover", function() { focus.style("display", null); })
      .on("mouseout", function() { focus.style("display", "none"); })
      .on("mousemove", mousemove);

    function mousemove() {
      var x0 = x.invert(d3.mouse(this)[0]),
          i = bisectDate(source, x0, 1),
          d0 = source[i - 1],
          d1 = source[i],
          d = x0 - d0.Date > d1.Date - x0 ? d1 : d0;

      if (vtype=="volume"){
      focus.attr("transform", "translate(" + x(d.Date) + "," + y(d.Volume) + ")");
      }
      else {
            focus.attr("transform", "translate(" + x(d.Date) + "," + y(d.Low) + ")");

      }
      focus.select(".tooltip-date").text(formatTime(d.Date));
      focus.select(".tooltip-volume").text(d.Volume.substring(0, 6))
      focus.select(".tooltip-price").text(d.Low.substring(0, 6));
    }


  var u = svg.selectAll(".lineTest")
  .data([source], function(d){ return d.Date })

  u
    .enter()
    .append("path")
    .attr("class","lineTest")
    .merge(u)
    .transition()
    .duration(1000)
    .attr("d", d3.line()
      .x(function(d) { return x(d.Date); })
      .y(function(d) {  if (vtype=="volume"){ return y(d.Volume);} else { return y(d.Low);} }))
      .attr("fill", "none")
      .attr("stroke", "#ff00cd")
      .attr("stroke-width", 1)
    })
    }
To add more events, just add another button with the date as an id.
<input class="button" type="button" value="London bombings (2005-07-07)" id="2005-07-07"/>
To add more stock data, put a .csv file in the main directory and modify HTML with the proper selector.
<option class="selector" id="OMCL.csv">Omnicell</option>You have many events to choose from and also you can sort graphs by price and volume where it's easier to notice spikes and drops.
Try these interactive charts in your browser.
If you stop the GIF and take a closer look at the chart, you will notice that before most of the events, the volume of trading shares increased significantly, sometimes a couple of days or a week before.
Conclusion
The CIA's Project Prophesy represents a groundbreaking example of how intelligence agencies are leveraging Open Source Intelligence (OSINT) to analyze complex financial data and predict market trends. By utilizing publicly available information such as news articles, social media posts, and economic reports, the CIA has been able to develop highly accurate models for forecasting market movements and identifying potential risks.
Nowadays, there are plenty of Project Prophesy-like solutions, in terms of gathering open source stock data. Visualize it and make decisions out of it. It's only difference of how to interpret the data, and what inside/confidential info you have to support such decisions.